
Companies Simplified – Zoom
-
By Parth Parikh

Have worked in the financial services industry for around 8 years now, and main areas of work have been Sector Research, Risk Management, Financial Modelling and Wealth Management.
Involved in the developoing content as a part of training in various Organizations like Kotak Securities, Motilal Oswal, Nippon Mutual Fund(erstwhile Reliance Mutual Fund), JPMC, Crisil.


In our series of presenting simplified perspectives of companies here is Zoom Company Analysis for you to have a quick understanding on the business segments, profitability and geographical spread.
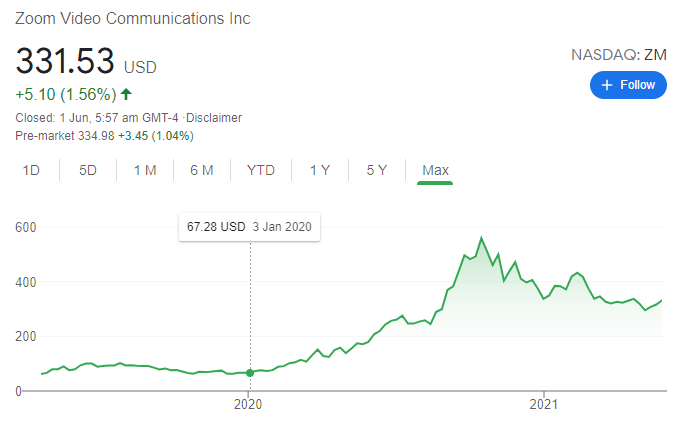
There is one company that undoubtedly got benefitted because of the pandemic is Zoom.
In a span of just 10 months, from Jan 2020 to October 2020, the stock jumped by 9x from USD 67 to USD 560, and then the downward trajectory started.
More numbers,
In December 2019, Zoom witnessed a peak of 10 million daily meeting participants, but by April 2020, they averaged 300 million daily meeting participants — 30x growth in about three months.
The story, however, is just phenomenal. Let’s dive into this Zoom Company Analysis.
Understand the Business
The business is not complicated. The offering as of now is simple. Here’s how ZOOM describes its business –
Our mission is to make video communications frictionless and secure.
We provide a video-first unified communications platform that delivers happiness and fundamentally changes how people interact.
However, internally Zoom has segregated multiple segments. As we speak, individual product level user data is not published by the company.
Segment 1: Communication Platform
- Meetings
- Chat
- Audio
- Phone
- Video Webinars
Segment 2: Conference Rooms and Spaces
- Rooms
- Conference Room Connector
- Digital Signage
- Scheduling Display
- OnZoom
- Zoom Apps
Segment 3: Developers
- API
- App Marketplace
- Mobile/Desktop SDK
- Zoom Hardware-as-a-Service
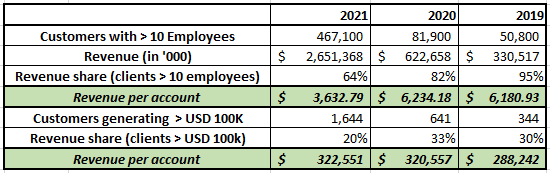
As a business, they captured 467,100 customers with more than 10 employees in FY 2020. This number was 81,900 customers in FY 2019, and the year before that, it was just 50,800 customers. Growth in acquiring customers is 200%.
What about small businesses with less than 10 employees? Zoom provides that information in the latest annual report.
In FY 2020, 36% of the revenue came from companies with less than 10 employees – that amount is ~USD 950 MM. But in FY 2019, just 18% of the revenue came from companies with less than 10 employees – that amount is ~USD 110 MM.
So, if we look at bigger client average revenue in FY 2020, that comes out to be ~USD 3600 (USD 2.6 BN * 64% / 467,100). In FY 2019, the average revenue per client was ~USD 6000 (USD 600 MN * 82% / 81,900).
The dip in the above numbers is primarily because of discounts and competition. The good part is smaller companies are now shifting towards paid service – which can potentially affect the travel-related services when the effect of the pandemic is over.
Another key metric in this Zoom Company Analysis to note is – customers generating > USD 100,000 in revenue. There is a significant increase in client generating more than 100K in revenues. In addition to that, there is no decline in average revenue generated per client in this category.
The below table summarizes the customer level data and calculation.
***** FinShiksha Learning Championship 2021 – Details here ******
Is Zoom profitable?
The numbers speak for themselves.
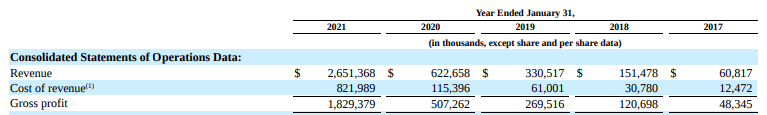
In 2017, the Revenues were just USD 60 MM, and from there, it clocked revenue of USD 2.6 Billion – CAGR of 112%.
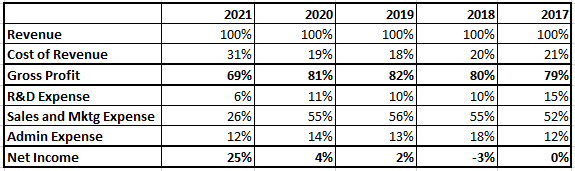
With the increase in revenue, did gross margins increased? No.
In 2017, Gross Margin was 80% which declined a bit to 70% in 2021. Reason being – the salary and compensation to employees.
If we proceed further, then we will notice that the company has become profitable.
From the loss in 2017 to a Net Income of USD 672 MN in just 5 years. Pandemic actually provided the push needed for growth.
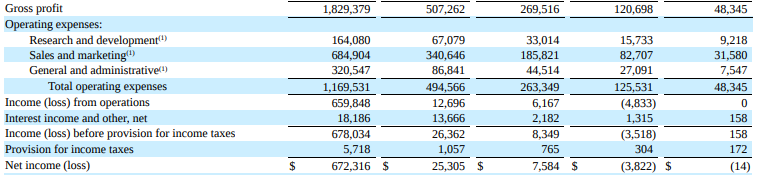
The below table summarizes the various headers as a % of revenue.
We can see that the Net Income margin is close to 25%.
Why did margins increase? Less amount spent on Sales and Marketing because everyone started using it due to pandemic – so word of mouth played a role here.
Can Zoom sustain this kind of margins? No one knows 🙂 Only time will tell.
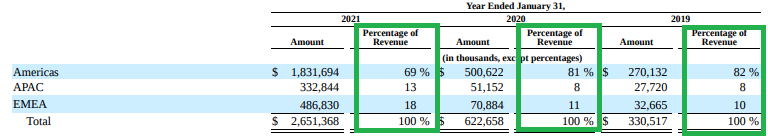
Zoom Geography Specifics
When we talk about geography, Americas account for the highest share, followed by APAC and EMEA.
However, again due to the pandemic, the revenue from other geographies have increased. Unlikely, this will go down because people have experienced the products, and small businesses will likely continue using products even after the pandemic.
When we talk about Saas in future – we will always mention Zoom. Zoom was at the right place at the right time. The company has shown scalability plus profitability – but can it sustain to grow and be profitable and give solid competition to the like of Google and Microsoft? Only time will tell.
Other Trending Posts in this Series – Disney | Netflix | Amazon
Stay updated about all of our posts on Businesses and Finance Careers – register and create a free account on our website. You will also get access to a free Finance Bootcamp course once you register.
-
About the Author
Have worked in the financial services industry for around 8 years now, and main areas of work have been Sector Research, Risk Management, Financial Modelling and Wealth Management.
Involved in the developoing content as a part of training in various Organizations like Kotak Securities, Motilal Oswal, Nippon Mutual Fund(erstwhile Reliance Mutual Fund), JPMC, Crisil. -
-
Register and get regular updates of new Blogs and access to Free Courses
-