FinShiksha Sector Insights – Airline Sector in India – Part 1
-
By Parth Parikh

Have worked in the financial services industry for around 8 years now, and main areas of work have been Sector Research, Risk Management, Financial Modelling and Wealth Management.
Involved in the developoing content as a part of training in various Organizations like Kotak Securities, Motilal Oswal, Nippon Mutual Fund(erstwhile Reliance Mutual Fund), JPMC, Crisil.


Disclaimer: The purpose of this document is purely educational in nature. The idea is to help someone kick-start their analysis of this sector/company. However, this is not to be construed as a recommendation of any sort on the company or its stock. All information has been sourced from publicly available data such as annual reports and news items and the veracity of the sources has not been independently established. Kindly use your judgement while analysing further or using this document.
Introduction to Airline Industry:
Indian Airline Industry is at a critical juncture. At one side the air traffic is ever increasing but at the same time airlines like Jet Airways is facing a Debt Crisis and as we speak it is grounded and all operations have been stopped. With that premise in mind, the rest of the post is written to give users specific nuances about the airline industry in India. This is part 1 of the long post.
Indian Air Passenger Traffic:
- India is the fastest growing airline market as per the International Air Transport Association (IATA) for the past three years followed by China. India has risen to be the third largest air travel market in terms of domestic passenger traffic behind only the United States and China and ahead of Japan, according to Centre for Asia Pacific Aviation India Private Limited (CAPA).
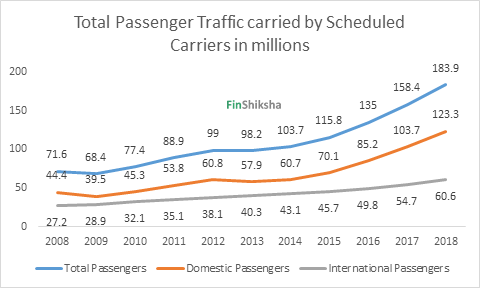
- As shown, domestic passenger traffic registered a compound annual growth rate (CAGR) of 10.76% during the period 2007-08 to 2017-18 while the international passenger traffic grew at 8.32% (CAGR) during the same period.
- The air transport market in India employs more than 400,000 people and supports another 940,000 more in the supply chain. Overall the industry contributes ~US$35 billion annually to India’s GDP.
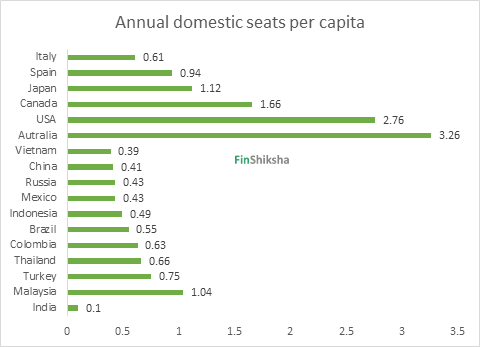
- Air travel penetration in India stood at 0.10 trips/capita in FY17, which is 59% lower than countries with similar GDP/capita, and 76% lower than BRICS nations (barring India), according to the Directorate General of Civil Aviation (DGCA) and IMF.
- Total Airports in India grew by 5 airports from 133 airports in 2017 to 138 airports in 2018. Importance of this is yet to be seen but at an overall plus with the proper implementation of UDAAN Scheme, the impact can be significant. Just think of it this way – a tourist from the US comes to India to visit Jodhpur however after Jet Airways is grounded, at least from Mumbai only one option is left to Jodhpur which is the morning Air India Flight and the same flight returns to Mumbai immediately as at present there’s no separate civilian airport in Jodhpur. Now if there’s small airport operational in Jodhpur and flight frequency can be increased then the impact can be huge. All small cities can be connected to all major metros.
Before we dig deep it is important for us to get acquainted with Key Terminologies:
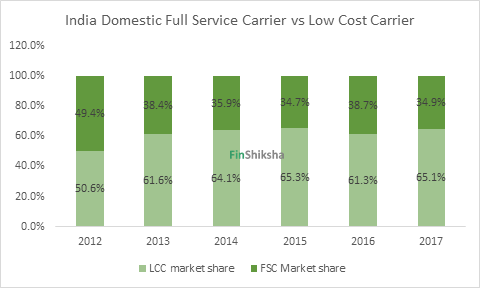
- Low-Cost Carrier (LCC): A low-cost carrier is an airline that is operated with a high emphasis on minimizing operating costs and without some of the traditional services and amenities provided in the fare, resulting in lower fares and fewer comforts. Example – IndiGo, SpiceJet, GoAir, Air India Express, and AirAsia India
- Full-Service Carrier (FSC): A full-service airline typically offers passengers inflight entertainment, checked baggage, meals, beverages and comforts such as blankets and pillows in the ticket price. The seats generally have more recline than a low-cost carrier as well as more leg room. Example – Jet Airways, Air India, Air Costa, Alliance Air and Vistara
- Scheduled Air Transport Services (Passenger): Scheduled air transport service means an air transport service undertaken between two or more places and operated according to a published time table or with flights so regular or frequent that they constitute a recognizably systematic series, each flight being open to using by members of the public. To simplify this is what as a passenger we consume. Example – AirAsia, Air India, Go Air, Interglobe, Jet Airways, Spicejet, Vistara etc.
- Non- Scheduled Air Transport Services (Passenger): This can be of various purposes a business using a charter flight, hot air balloon is used for fun activity etc. Charter Operations are part of this. Example – Ventura Airconnect, Pawan Hans limited, Reliance Transport, Karnavati Aviation, Reliance Commercial, Club One, Deccan, Taj Air, Titan Aviation, Ghodawat etc.
- Air Transport Services (Cargo): Air Cargo operations are activities for air transportation of cargo and mail. Operations by the Air Cargo Operators can be scheduled or non-scheduled operations. Example – Blue Dart Aviation, DHL etc.
- Airport Slot: An Airport slot or a “Slot” is a permission given by a coordinator for a planned operation to use the full range of airport infrastructure necessary to arrive or depart at a Level 3 airport on a specific date and time. (More information here: http://www.civilaviation.gov.in/sites/default/files/moca_003128_0_0.pdf)
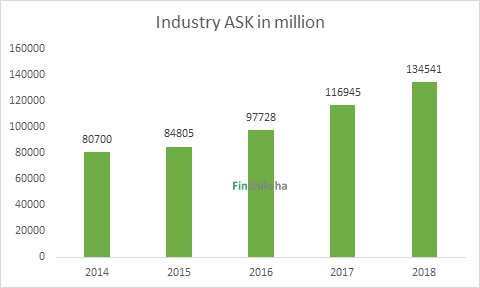
- Available seat Kilometer: Available Seat Kilometer (ASK) measures an aeroplane’s passenger carrying capacity by multiplying the number of seats available on the aircraft to kilometres flown by aircraft. ASKs determines supply in the airline industry. Lesser the supply higher is the impact on prices.
- Illustration: Indigo operates one A320 NEO aircraft with a capacity of 180 passengers between Mumbai and Delhi. Distance between Mumbai and Delhi is 1500 Kilometers which means ASK for indigo’s that particular flight is (180 seats *1500 KM)= 270,000. The industry ASK has increased over the last few years, indicating increasing supply, though this still has a large scope of increase.
- Revenue Passenger kilometre: Revenue Passenger Kilometers (RPK) shows the number of kilometres travelled by paying passengers. Since it measures the actual demand for air transport, it is often referred to as airline “traffic.”
- Illustration: Indigo operates one A320 NEO aircraft with a capacity of 180 passengers between Mumbai and Delhi. However, the number of revenue-generating passengers on the flight is 150. Distance between Mumbai and Delhi is 1500 Kilometers which means RPK for indigo’s that particular flight is (150 seats *1500 KM)= 225,000

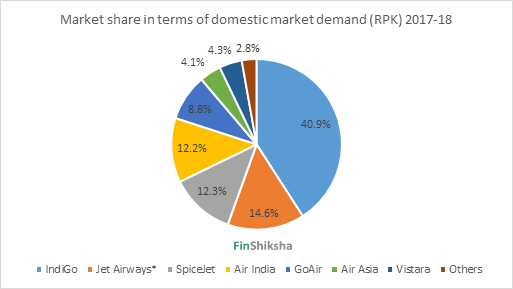
*Jet Airways operated only 5 aircrafts as on 16th April 2019 due to non-payment of loan and rentals.
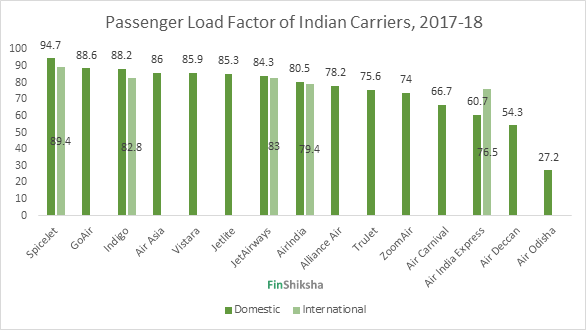
- Passenger Load Factor: Passenger load factor measures the capacity utilization of an airline. A high load factor indicates that an airline has full planes with most seats occupied by passengers. PLF above 75% is desirable for the sustainable and profitable operation of an airline. Since airline works on operating leverage (high fixed costs) it becomes imperative for an airline to have as high as PLF to make a reasonable amount in the bottom line. PLF is calculated by dividing RPK with ASK.
- Illustration: For the year 2017- 2018, Indigo’s available seat kilometre (ASK) in millions was 54298 while its Revenue passenger kilometre (RPK) was 47899 million. Indigo’s Passenger load factor for the year 2017-18 was (47899/54298)*100= 88%. PLF for other carriers is as mentioned below.
- Yield: It shows an average fare per passenger per kilometre. It is useful in evaluating changes in fares over time. This metric takes only revenue from ticket sales.
- Illustration: For the year 2017- 2018, Indigo’s revenue from the sale of passenger ticket was Rs.19943 crore while its Revenue passenger kilometre (RPK) was 5552 crore. Indigo’s yield for the year 2017-18 was (19943/5552) = Rs 3.6
- Revenue per available seat kilometre: It measures the average amount of revenue received by airline per unit of capacity available for sale. A higher RASK is an indication that an airline is able to operate it’s fleet more profitably when compared to other airlines assuming cost remains constant. This metric takes total operating revenue.
- Illustration: For the year 2017- 2018, Indigo’s total operating revenue was Rs.23021 crore while its Available seat kilometre (ASK) was 6351 crore. Indigo’s RASK for the year 2017-18 was (23021/6351) = 3.62
- Cost per available seat kilometre (CASK): CASK shows cost per available seat kilometre. It allows a cost comparison between different airlines. One disadvantage of CASK is it includes the costs incurred by no passenger divisions, such as cargo or maintenance.
- Illustration: For the year 2017- 2018, indigo’s total operating cost excluding finance cost was Rs.20064 crore while its Available seat kilometre (ASK) was 6351 crore. Indigo’s CASK for the year 2017-18 was (20064/6351) = 3.2
- CASK ex-fuel: CASK can also be calculated net of fuel cost. Due to the volatility of oil prices, airline fuel cost is generally not viewed as controllable. Therefore, management’s success at controlling costs is often judged by looking at how the airline’s ex-fuel CASK changes from one period to another.
- Illustration: For the year 2017- 2018, indigo’s total operating cost excluding finance cost and aircraft fuel expenses was Rs.11940 crore while its Available seat kilometre (ASK) was 6351 crore. Indigo’s CASK for the year 2017-18 was (11940/6351) = 1.88
- Aviation turbine fuel (ATF): Aviation Turbine Fuel is a specialized by-product of crude or petroleum used to power aircraft. Aircraft Turbine Fuel or ATF is among the largest cost drivers in the airline industry. The Aviation Turbine Fuel (ATF) price is announced every month for the various airports in the country, based on the prevailing exchange rate and global fuel prices. Price of ATF is available at https://www.iocl.com/Products/AviationTurbineFuel.aspx
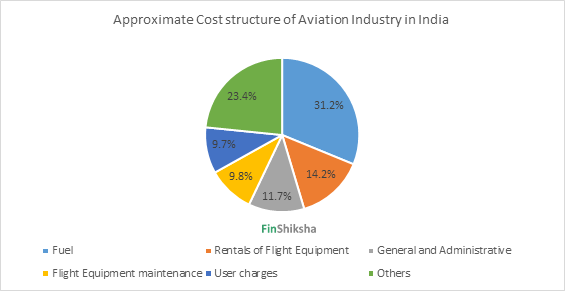
*User Charges Including landing and associated airport charges and Air Navigation charges
- Block Hours: The number of block hours for a flight is the time from the moment the aircraft door closes at the departure of a flight until the moment the aircraft door opens at the arrival gate following its landing. The number of block hours for an airline for a given period of time (like a year, quarter or month) is a measure of the total time that its aircraft were in use during that period.
- Block hours per day: It is a measure of aircraft productivity, calculated by dividing aircraft block hours by the number of aircraft days assigned to service on air carrier routes. Block hours per day indicates the capacity utilization in terms of aircraft being in commercial operation during a day out of the total 24 hours. The lesser the idle time, the higher the aircraft utilization. In fiscal 2017, Indigo’s average aircraft utilization in block hours was 12.9 hours per day per aircraft, higher than the average of 11.4 block hours for all other Indian carriers, according to CAPA.
- Technical dispatch reliability: Technical dispatch reliability refers to the percentage of total departures that depart within 15 minutes of the scheduled departure time.
- On-time performance (OTP): On-time performance refers to the level of success of the air services remaining on the published schedule. OTP could be considered as an important indicator of an airlines’ service quality. Indian airline operators have maintained OTP above 60% with Interglobe and Spicejet leading the OTP between the four major metros (New Delhi, Mumbai, Bengaluru and Hyderabad) at 75.4% and 74.4% respectively. Source CARE Ratings report on airlines and airports.
- Players: There were 17 scheduled aircraft operators operating in India in 2017-18.
- Out of total 93 scheduled international operators, top 6 operators accounted for nearly 50% of total international Passenger traffic and top 15 operators accounted for nearly three fourth of the total international Passenger traffic in the year 2017-18.
Market share of scheduled operators- International operations 2017-18:
| Scheduled Operators | Market share |
| Jet Airways | 13.80% |
| Air India | 10.40% |
| Emirates | 9.20% |
| Air India Express | 6.20% |
| Indigo | 5.30% |
| Ethihad | 4.30% |
In the next part we will continue our discussion on the key industry drivers and business metrics for individual companies.
-
About the Author
Have worked in the financial services industry for around 8 years now, and main areas of work have been Sector Research, Risk Management, Financial Modelling and Wealth Management.
Involved in the developoing content as a part of training in various Organizations like Kotak Securities, Motilal Oswal, Nippon Mutual Fund(erstwhile Reliance Mutual Fund), JPMC, Crisil. -
-
Register and get regular updates of new Blogs and access to Free Courses
-