Here is Disney Company Analysis for you to understand the different segments and revenue and profitability numbers.
What do you think when you hear the word – Disney
Disneyland, isn’t it? For most of us, Disney is synonymous with Cartoons (Mickey Mouse/Donald Duck) or Disneyland (Themeparks).
However, Disney is much more than that. It has evolved into a content company now, or as I say, it is still evolving 🙂
Above all, let’s try and understand various segments and specific nuances around each segment.
Business Segments
In this Disney Company Analysis, we can see that there are four business segments, namely.
- Media Networks
- Parks, Experiences and Products
- Studio Entertainment
- Direct-to-Consumer & International

So we can clearly see that Disney is much more than the Parks business.
In addition to that, see below for the percentage revenue generated from each segment and how it is moving.

In 2020, you will see the Theme Park segment contributed just 23% primarily because of the pandemic. We will see a clearer picture once this pandemic is over worldwide.
Segment 1: Media Networks
This particular segment generates revenues through three sub-businesses, namely.
- Affiliate fees – Fees charged to multichannel video programming distributors (i.e. cable, satellite, telecommunications and digital over-the-top (OTT) (e.g. Hulu, YouTube TV) service providers)
- Advertising – Sales of advertising time/space on Disney’s domestic networks and related platforms and the sale of advertising time on their domestic television stations.
- TV/SVOD distribution – Licensing fees and other revenues from the right to use Disney’s television programs and productions and revenue from content transactions with other Company segments (“program sales”)
If we see then more than 50% revenue is generated from Affiliate Fees. This is like Disney getting fees from Comcast etc. (similar to Tata Sky or Airtel in India). More the bundles they sell and more people opt for Disney channels, the more money Disney gets.

Look at how many subscribers Disney have on its various channels
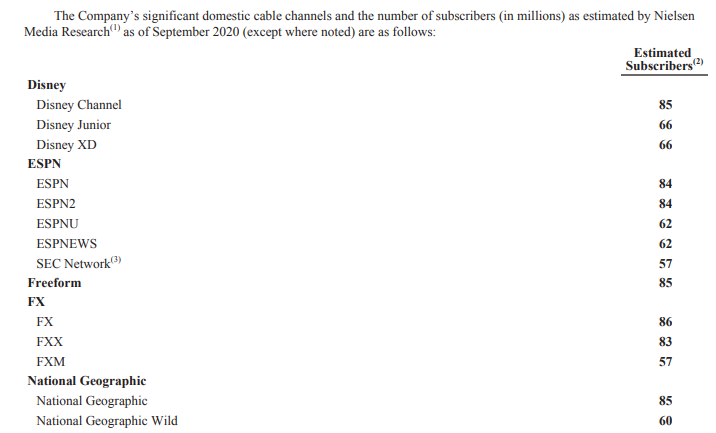
Disney Domestic Market
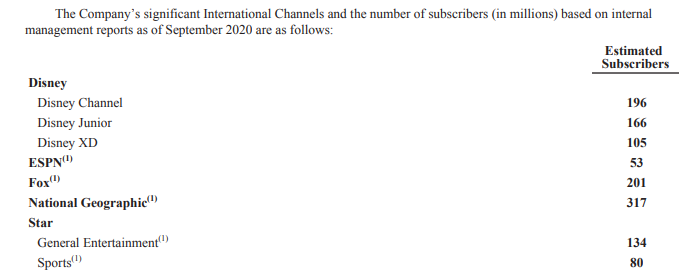
Disney International Market
Segment 2: Parks, Experiences and Products
This particular segment generates revenues through sub-businesses, namely
- Theme park admissions fees
- Parks & Experiences merchandise, food and beverage
- Resorts and vacations – Sales of room nights at hotels, sales of cruise and other vacations
- Merchandise licensing – Royalties from intellectual property licensing
- Retail – Sales of merchandise at The Disney Stores and through branded internet shopping sites/wholesalers (including books, comic books and magazines)
- Parks licensing and other – Revenues from sponsorships and co-branding opportunities and real estate rental and sales. In addition, Disney earns royalties on Tokyo Disney Resort revenues.

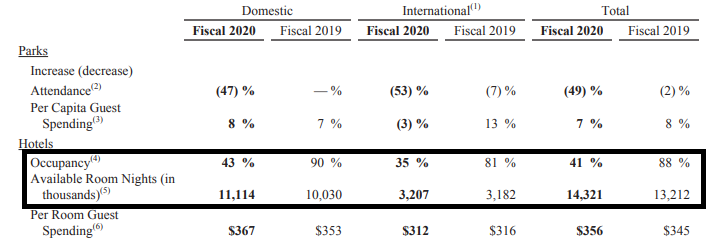
The key over here is the consumption of whatever Disney has to offer. For example, Disney have close to 36,000+ hotel rooms, and the occupancy rate is close to 90% (Indian Hotels have close to 18,000 rooms with an occupancy rate of just around 65%)
***** FinShiksha Learning Championship 2021 – Details here ******
Segment 3: Studio Entertainment
This particular segment generates revenues through sub-businesses, namely
- Theatrical distribution – Rentals from licensing their motion pictures to theatres
- Home entertainment – Sale of their motion pictures to retailers and distributors in physical (DVD and Blu-ray) and electronic formats
- TV/SVOD distribution – Licensing fees and other revenue from the right to use their motion picture productions. Example – Netflix acquired rights to showcase some Disney movies, and Netflix will pay Disney for the same.

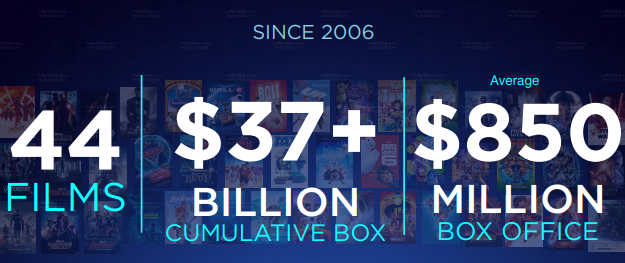
Disney Pixar launched 22 Films since 2006, and the average Box Offfice collection is $690 Million.
Marvel launched 18 Films since 2009, and the average Box Offfice collection is $960 Million.
Star Wars launched 4 Films since 2012, and the average Box Offfice collection is $1.2 Billion.
In addition to the above, see the below data –
Now you know what Disney is 🙂
Segment 4: Direct-to-Consumer & International
This particular segment generates revenues through sub-businesses, namely
- Subscription fees – Fees charged to customers/subscribers for Disney’s video streaming services. Disney+, Hotstar subscription revenue falls here.
- Advertising – Sales of advertising time/space on their International Channels
- Affiliate fees – Fees charged to MVPDs (Multichannel Video Programming Distributors) for the right to deliver Disney’s International Channels to their customers, and here the example is Disney charging Tata Sky.
- TV/SVOD distribution – Program sales, sub-licensing fees for sports programming rights and fees charged to customers to view their sports programming (“pay-per-view”) (e.g. Ultimate Fighting Championship) and Premier Access content (e.g. Mulan on Disney+)

Look at the growth – Subscription fees increased close to 4x. That will continue to grow in the coming future as well considering the focus on the streaming service. More on Disney’s Vision
Moving on to Profitability now
The table below provides a comprehensive understanding of the Operating Margins of various business segments. As we can see, the margins of three segments, namely Media Networks, Parks and Studio Entertainment, is more or less constant. The dark horse in this growth story is going to be D2C and International Business.
Above all, the key focus for the next 4-5 years will be Disney+ and content on that.

And if we look at a company level, then margins are healthy. (last year was an exception)

To conclude this Disney Company Analysis, we can say that Disney is playing on content that they have, and now the sole focus is to reduce the churn on D2C channels and provide enough content so that the subscribers are added at a fast pace.
Other Trending Posts in this Series – Spotify | Netflix | Amazon
Stay updated about all of our posts on Businesses and Finance Careers – register and create a free account on our website. You will also get access to a free Finance Bootcamp course once you register.


