Disclaimer: The purpose of this document is purely educational in nature. The idea is to help someone kickstart their analysis of this sector/company. However, this is not to be construed as a recommendation of any sort on the company or its stock. All information has been sourced from publicly available data such as annual reports and news items and the veracity of the sources has not been independently established. Kindly use your judgement while analysing further or using this document.
We would like to applaud the efforts put in by four students from Xavier Institute Management Bhubaneshwar (XIMB) – Anirudha Basak, Manan Gupta, Shobhit Jain and Vaibhav Saith (in alphabetical order) as a part of Live Project with FinShiksha.
This article is the last article in the series talking about India’s Retail Industry.
In the First part, we talked about how much India is important? What are the various categories in the retail sector? How does future growth look like? The link to the first article can be found here
In the Second part, we talked about various metrics through which we can evaluate Retail Industry and Players within the same. We evaluated few companies through metrics and the link to the second article can be found here
In the Third and final part, we will talk about some part of the valuation, forecasting and what the Industry will Transform into?
So Let us start with what companies are doing currently:
Contrary to the general belief that companies are going online and shoppers are buying everything online is NOT TRUE.
Nearly 91% of retailers and brands currently have an omnichannel strategy or are planning to invest in omnichannel technologies in the near-term.
Now questions arise, what is Omnichannel Retailing?
- Omnichannel refers to retailing simultaneously through both off-line channels like physical stores and online through online market places like mobile applications and company websites.
- Under Omnichannel strategy, the different channels used by customers are interconnected and they can effortlessly switch between them.
Follow On Question: Why is it desired?
Let’s try and connect some dots and break some myths-
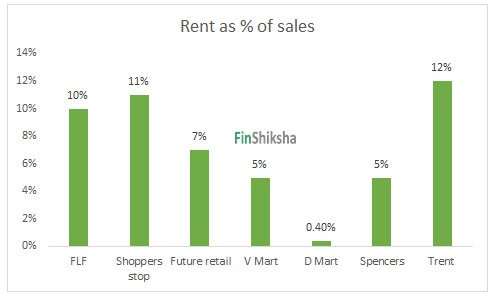
- Myth 1: It increases cost. WRONG!!! An omnichannel strategy helps to reduce costs. Rent and employee cost forms a significant expense for a bricks and motor retailer which can be reduced with the help of online retailing. While the physical stores can serve as a distribution hub for online purchases and thereby reducing logistics cost. Check below graphs to understand the same.

- Businesses with omnichannel strategies have 91% greater year-over-year customer retention rates against those that don’t, per Aspect Software.
- India has 6,000 cities and 600,000 villages which account for 70% of India’s population. Retail e-commerce provides delivery to just 200 cities (Imagine the growth for someone like Swiggy, Zomato etc. IMMENSE – no wonder they get valuation), with grocery e-commerce available in a mere 30 cities. This indicates that 80% of the population and over 50% of national income is missing from retail e-commerce.
- The consumers want to touch and feel the products they buy as much as they want to shop within the comforts of their home, has compelled retailers to implement an omnichannel strategy. So, if a consumer wants to exchange a product, she has the option of going to the nearest store to return the product she has bought online, browse through other options at the physical store, even try it out and then buy a product of her choice. Example: Lenskart is successfully integrating this strategy into its business.
Do we have any proof?
Reliance Retail
- India’s largest retailer Reliance is focusing on a hybrid, online-to-offline new commerce platform. It is trying to digitise small merchants and shopkeepers by providing them with merchant point of sale (M-PoS) machines.
- Jio’s M-PoS machine is a smartphone that helps to process both cards and digital transactions. Additionally, it doesn’t charge a merchant discount rate (MDR) and offers a loyalty program. MDR is potentially a game-changer for Jio.
- It allows merchants to track their inventory, allowing small retailers to manage their supply chain better. However, Kiranas either found it difficult to enter new inventory items or were reluctant to enter with a fear of sharing data with POS firms. (If inventory management system is efficient then wastages can be reduced and more relevant products are made available at the right time at the right point).
- Reliance is developing an e-commerce platform which will be a one-stop-shop for offline merchants to manage their inventory, logistics and supply chain requirements; accept payments and credit money back; and place orders from Reliance’s cash-and-carry or wholesale mega-stores, file GST by inputting invoices and order for a pick-and-drop to a customer’s doorstep.
DMart
- DMart has set up small DMart Ready stores across Mumbai (this is still a pilot as per official company’s statement), from where customers can pick up the products that they have ordered online. They can even get their orders home delivered but at an additional cost.
- In 2019, D’Mart Ready registered revenue of Rs.143 crores up from Rs.44 crore in FY19. It also suffered a loss of Rs.50.82 crore against the loss of Rs.48.08 crore in FY 2018.
Shoppers stop
- Shoppers Stop has adopted an omnichannel with departmental stores, an e-commerce website and a mobile application – Endless Aisle.
- Customers can buy – online and collect from the store. Shoppers stop does not operate a separate inventory for its e-commerce business but leverages brick-and-mortar strength towards logistics and delivery.
- The app allows customers to learn more about a product by clicking a picture of it. It can also recommend the right apparel/accessory size and fit shoppers.
- Shopper stop recorded 71 million visits to its website and 5.5 million mobile app downloads serving 25,000 pin codes during the FY19 leading to a 43.8% growth in online sales.
- Shoppers stop is planning to increase revenue contribution from Digital from 2% in 2018 to 10% in 2021. Amazon India picked up a 5% stake in Shoppers Stop for Rs 179.25 crore.
Westside
- Trent’s Westside has aligned the online and in-store offerings. It has an exclusively online presence through Tatacliq – a Tata Group marketplace initiative.
- Westside has enables various technologies which allow a customer to enter a store, have a look at the latest fashion offer, touch and feel the products, try and buy it using their smartphones and receive it at home/office.
- Trent has also introduced Starquik – the online grocery portal.
Future Retail
- Future retail has also firmed up the stage for a strong omnichannel business and Online to Offline Conversions.
- It has introduced the Easyday Club mobile app for ordering products, scheduling home deliveries and store pick-ups, along with many other features for its member customers
- Customers can choose to scan the bar code of any product from their kitchen and add to their shopping basket. They can even do it within the store, pay on the app and walk out of the store without going to the cash counter.
- The app-based platform is integrated with the Future Pay mobile wallet. It is future group’s digital payment wallet with the feature of EMI facility for spends above certain limit across stores of the company (through EMI network card co-branded with Bajaj Finance),
- As of March 2019, this has been introduced in over 140 stores in Delhi NCR and has resulted in a significant increase in spends and frequency of our member customers.
Even Etailers are trying to develop physical presence. In 2017 offline channels contributed significant revenue to the total revenue of the Etailers.
|
Etailers |
Offline Channel’s share of the revenue |
| Lenskart | 50-60% |
| Pepperfry | 20-30% |
| FirstCry | 30% |
| Zivame | 20-25% |
| Clovia | 5-7% |
Convenience is the key. You will see a lot of integration between electronic platforms and physical stores in the next few years. Considering the extent of Kirana Stores and reach they have, don’t be surprised if companies start using them as distribution centres and accommodate them in the overall strategy. This reduces the cost greatly by using the existing infrastructure and expands the business pretty quickly.
Now let’s focus our attention to forecasting – First step towards the valuing a company. How to estimate future revenue of retailers?
We can estimate future revenue for a retailer by understanding various factors affecting the revenue. Basically identify the revenue drivers.
Approach 1: Based on Store Size and Revenue per Sq Ft
Estimating the total revenue while considering average store size can be explained with the help of the following illustration of central stores which is a part of Future Lifestyle Fashion.
| Central | FY16 | FY17 | FY18 | FY19 | FY20 (E) | FY21 (E) | FY22 (E) |
| Number of stores | 31 | 35 | 40 | 44 | 50 | 55 | 60 |
| Avg. store size (‘000 sqft) | 102.9 | 100.0 | 92.5 | 90.5 | 88.5 | 86.5 | 84.5 |
| Changes in average store size | -2.9% | -7.5% | -2.0% | -2% | -2% | -2% | |
| The total retail area in mn square feet | 3.19 | 3.5 | 3.7 | 3.98 | 4.42 | 4.76 | 5.07 |
| Revenue per square feet (in Rs.) | 5,987 | 6,486 | 6,784 | 7,183 | 7,543 | 7,920 | 8,316 |
| YoY change in revenue per sqft | 8% | 5% | 6% | 5% | 5% | 5% | |
| Total Revenue (in Cr.) | 1,910 | 2,270 | 2,510 | 2,859 | 3,336 | 3,766 | 4,214 |
All the bold items are numbers which are assumed based on the previous years or certain data given by the company.
- We have assumed that the company opens net 5 central stores each year till 2022 based on certain company reports.
- The average store size of the centre has been continuously decreasing. We have assumed that it will decrease by 2,000 square feet each year based on the decrease in store size in FY19.
- The total retail area is equal to (Number of central stores) * (Average store size).
- Revenue per square feet is assumed to increase by 5% each year based on the previous years’ average. (Basically slight price increase + inflation)
- Total revenue is arrived by multiplying the total retail area and revenue per square feet.
Approach 2: Based on Footfalls and Revenue generated per user
We estimate revenue based on footfall can be illustrated with the help of Westside which is a part of Trent a TATA Group company.
| Westside | FY17 | FY18 | FY19 | FY20 (E) | FY21 (E) |
| Number of stores | 107 | 125 | 150 | 167 | 191 |
| Annual footfall per store | 244,299 | 289,120 | 299,333 | 309,511 | 320,034 |
| Total annual footfall (in Cr.) | 2.61 | 3.61 | 4.49 | 5.17 | 6.11 |
| Conversion Rate | 32% | 25% | 22% | 20% | 20% |
| Number of bills in crore | 0.83 | 0.9 | 1.0 | 1.0 | 1.2 |
| Average bill size | 2,029 | 2,197 | 2,332 | 2,519 | 2,720 |
| Total Revenue (in Cr.) | 1,684 | 1,977 | 2,304 | 2,604 | 3,325 |
All the bold items are number which is assumed based on the previous year or certain data given by the company.
- Trent has added 25 Westside stores in 2019 we assume that company will further add 17 stores in 2020 and 24 stores in 2021.
- Annual footfall per store is expected to increase by 3% each year based on the average growth of the last 4 years.
- Total annual footfall is obtained by multiplying the total number of stores to annual footfall per store.
- The conversion rate of the Westside is continuously falling. We expect it to reduce further to 20%. (Basically out of 100 customers visiting the store, 20 will convert and make some purchase at an average price defined)
- The total number of bills issued in a year is derived by (Annual total footfalls) * (conversion rate)
- Average bill size has grown at an average of 8% from FY13 to FY19. We estimate it to grow at the same rate in future.
- Total revenue is arrived by multiplying the number of bills to the average bill size.
The calculation seems simple, isn’t it? Focus on the assumptions more. Questions should be asked why the growth of 5% or why prices will increase by 10% etc. Retail Industry calculations are not difficult. But what is most difficult is the ASSUMPTIONS. So always stay cautious while putting any number and then valuing the same.
So, that’s all from our end as of now with respect to India’s Retail Industry Landscape. Hope you have enjoyed it.
Share it further 🙂