
Disclaimer: The purpose of this document is purely educational in nature. The idea is to help someone kickstart their analysis of this sector/company. However, this is not to be construed as a recommendation of any sort on the company or its stock. All information has been sourced from publicly available data such as annual reports and news items and the veracity of the sources has not been independently established. Kindly use your judgement while analysing further or using this document.
We would like to applaud the efforts put in by four students from Xavier Institute Management Bhubaneshwar (XIMB) – Anirudha Basak, Manan Gupta, Shobhit Jain and Vaibhav Saith (in alphabetical order) as a part of Live Project with FinShiksha.
This article is second in the series talking about India’s Retail Industry.
In the first part, we talked about how much India is important? What are the various categories in the retail sector? How does the future growth look like? The link to the first article can be found here
In this article, we talk about Apparel Market and some of the operational metrics across companies to understand the performance within the Retail Industry.
Retail Apparel Market
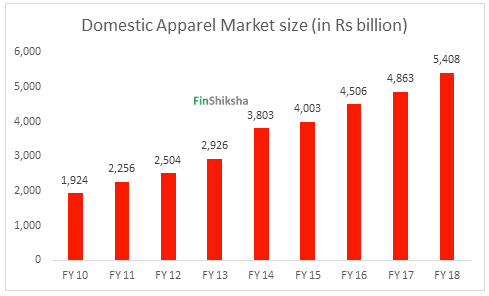
- Indians spent Rs. 5,408 Billion on buying clothes in 2018 up from Rs. 4,863 Billion in 2017. And this will continue to grow because of demographic India has and another reason being, the increase in disposable income.
- The size of the Apparel market in India has grown at a CAGR 13.8% in over the past 8 years.
- Apparel and Accessories are the second-largest segments after Food and Grocery of the Indian Retail market.
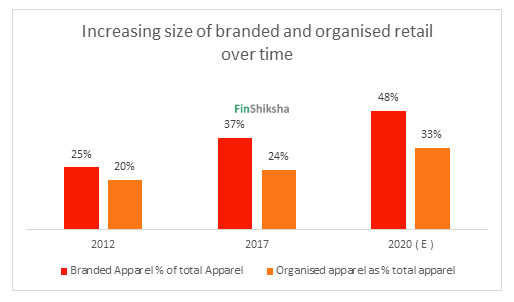
- The Organised Retail penetration in Apparel and Accessories segment stood at 24% in 2017, leaving open a significant opportunity for the organised apparel retail players in India. As per the Technopak report, the Organised Retail penetration in Apparel and Accessories is expected to reach 31.6% in 2020.
- The Branded Apparel market has grown at a CAGR of 19% from 2012 to 2017. Consequently, the share of Branded Apparel to the total Apparel market has increased from 25% to 37%.
How is the Apparel Market divided?
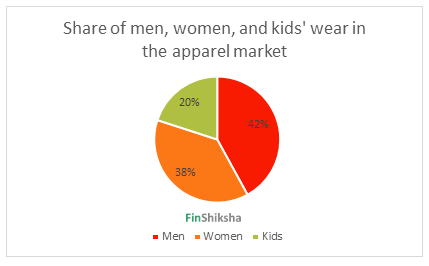
- The Indian Apparel Market is divided into men’s wear, women’s wear and kids’ wear segment.
- Currently, Indian apparel retail market is dominated by men’s apparel by Value (this will come as a surprise to a lot of us). However, further growth in the Apparel Market will be contributed by women and kids’ apparel.
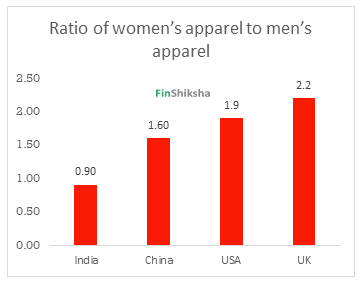
- In fact, women’s wear category is expected to outpace the men’s wear category and occupy a majority market share of 41% by 2025.
- In mature markets like the USA and the UK, women’s apparel is emerging as the dominant segment.
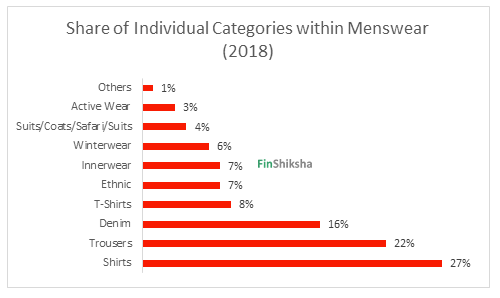
- Men’s wear category is dominated by shirt, trousers and denim accounting for 65% of men’s wear market. Denim wear, smart casuals and athleisure are expected to push demand for the segment, going forward.
- Women’s wear category is dominated by saree, ethnic wear and innerwear accounting for 81% of woman’s wear market. Western wear, fusion wear and specific ethnic wear are expected to drive demand.
- Kid’s wear is dominated by uniform both in both boy’s wear and girl’s wear categories.

- Value fashion stores is a big format store concept, where branded products and accessories are sold under discounts. Value fashion is an important segment in fashion retail with the possibility of appealing to the wider customer base and reaching more addressable geographies.
- Popular and mass-priced products possibly constitute over 75% of the total fashion market in India.
Ok, this is great. Now how to understand the Sector with Metrics?
Major operating Parameters for a retail company
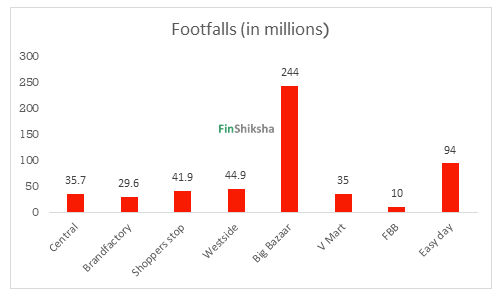
Footfalls:
- Footfalls are the number of people visiting the stores of the company. An increase in the number of footfalls is directly related to the increase in revenue. (Avenue Supermart doesn’t provide Footfalls – they provide bill cut data hence not included in the chart. Bills Cuts at Avenue Supermart as on 2018-19 is 172 Million).
- Generally, retailers whose revenue is dominated by Food & Grocery experienced higher footfalls as compare to retailers whose revenue is dominated by Apparel.
Caveat: Since Food and Grocery format experiences higher footfall – the comparison should be within the category and not across the category. Below chart depicts the same.
- Shopper stop has experienced a continuous drop in its footfall from FY17. Consequently, the company’s revenue has reduced from Rs.4900 crores in 2017 to Rs.3500 crores in 2019.
- V-Mart’s footfall has increased constantly due to high growth in the number of stores.
- There is a significant rise in the footfall of Brand Factory from 16.3 million in FY17 to 29.6 million in FY19.
- Future retail’s Easyday has experienced a 24% CAGR growth in the number of footfalls from 2016 to 2019 due to tremendous growth in the number of Easyday stores. Competition to this is DMart Ready format. Watch out for this space as companies fight for omnichannel distribution.
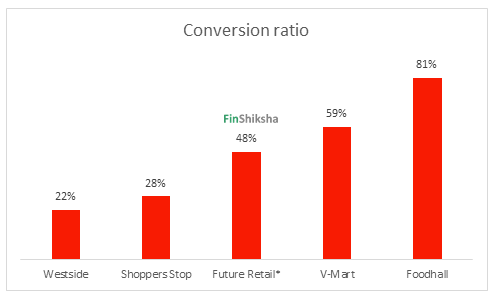
Conversion ratio
- The conversion ratio is the ratio of the number of bills generated to the total footfall into the stores.
- Higher the ratio indicates higher productivity of front-end store employees and the attractiveness of the merchandise and services.
 * For FY 17
- Westside and V-Mart have experienced a constant year on year decline in conversion rate. One of the reason being, online fashion retail is getting popular in Tier 2,3,4 Cities.
- The number of footfalls in Westside and V Mart stores has increased by 72% and 42% over the past two years. However, its revenue per customer has reduced by 21% and 2% respectively. This implies that customers visiting the stores have increased but they are purchasing less. Hence the conversion ratio of both the companies is affected.
- Foodhall is a part of Future retail group and has the highest footfall conversion ratio. It’s an upmarket provider of grocery. Unlikely that it can be sold as an online format to a larger set of customers.
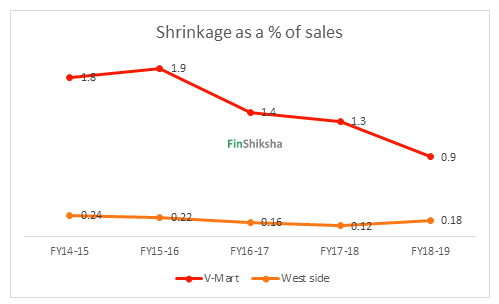
Shrinkage as a % of sales
- Shrinkage pertains to a loss of inventory that isn’t caused by actual sales. It may be due to shoplifting, paperwork errors, supplier fraud, mismanagement of inventory. Only two companies give data publicly.
- Higher the shrinkage translated to lower profitability.
- A low shrinkage as a % of sales is desirable. A constant falling shrinkage as a % of sales ratio is viewed positively.
Same-store sales growth (SSSG) / like for like growth (LFT)
- SSSG is used for measuring productivity and performance.
- It is the growth in revenue from sales of the same stores that have been operational for at least 24 months at the end of a fiscal.
- It excludes revenue from new stores while calculating the growth rate of revenue.
- Some companies exhibit growth in revenue by opening new stores. Some companies exhibit growth by making more money from the stores they already own. Same-store sales information points out the difference.
- An increase in SSSG is viewed positively, however, a negative SSSG could serve as an indication that customer interest in its products or services is fading, or that a company’s new stores are taking away business from its existing ones. Basically cannibalization is happening.
Annual SSSG of retail companies
| Company Name | FY 16 | FY 17 | FY 18 | FY 19 |
| Big Bazaar | 13% | 14% | 13% | 11% |
| Future Retail (Including Big bazaar) | NA | 12% | 10% | 7% |
| Central | 10% | 18% | 10% | 6% |
| Brand Factory | NA | 17% | 16% | 14% |
| Future Lifestyle Fashion – Overall | 9% | 16% | 12% | 9% |
| D-Mart | 22% | 21% | 14% | 18% |
| V-Mart | -1% | 13% | 9% | 4% |
| Shoppers Stop | 9% | 3% | 2% | 4% |
| Westside | 8% | 9% | 9% | 9% |
| Star | 9% | 2% | 8% | NA |
| ABFRL – Madura | 0% | -7% | 9% | 5% |
| ABFRL – Pantaloons | 6% | 3% | -3% | 1% |
- Big Bazaars SSSG has been continuously falling from FY17. Consequently, SSSG of Future Retail (FRL) is tumbling. Large-format stores like Big Bazaar, FBB and Hypercity contribute 85% of FRL’s total revenue.
- SSSG of future lifestyle fashion (FLF) has been constantly decreasing due to falling SSSG of Central and Brand Factory.
- D-Mart has the industry-leading SSSG in most of the financial years. Baring D-Mart, Shoppers stop and Pantaloons, all the other retailers have experienced a drop in SSSG in FY19.
- Westside has experienced a constant SSSG for 3 years. However, SSSG of Westside has improved significantly in the H1FY20.
- V-Mart’s SSSG has been affected due to the increase in competition from regional and national players. Management has set a target to achieve at least 7% SSSG.
Growth in the number of stores
- Generally, continuous growth in the number of stores with an increase in revenue and profitability is considered positive.
- However, in some cases like Spencer, the tremendous growth in the number of stores resulted in a negative profit. In such a scenario reducing the number of stores will be welcomed.
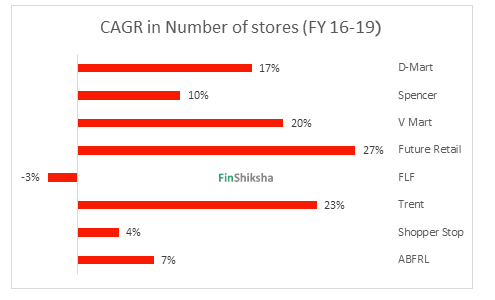
- Future lifestyle fashion has experienced degrowth in the number of stores as over the last two years, the company has consolidated its exclusive brand outlets and it is increasing its Brand factory and central stores; total EBOs reduced to 202 in FY19 compared to 284 in FY17.
- Future Retail, Trent and V-Mart have added a significant number of stores in past 3 years.
- Future Retail is continuously adding small-format stores, while Trent is adding Zudio and Westside stores across India and V-Mart is increasingly expanding its presence in Tier 3 and Tier 4 cities.
Private labels sales as a % of total sales
- A private label product is manufactured by a contract or third-party manufacturer and sold under a retailer’s brand name. Private labels are attractive to retailers as they enjoy higher margins, greater customer loyalty, clear product differentiation and higher bargaining power with suppliers.
- According to Philip Capital report, controlling the entire value chain – from contract manufacturing to logistics can help companies to offer products at 20-30% lower prices.
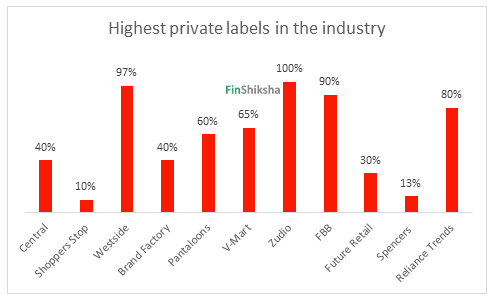
- Both Westside and Zudio are a part of Trent group and have the highest share of private label in the industry. The share of private labels sale to total sales has been constantly increasing for Westside
- In the case of Shoppers Stop, the contribution of private labels to total sales has fallen consistently. This is due to design and pricing issues. STOP’s (Private label of Shopper’s Stop) pricing was benchmarked in line with premium brands and also the unattractive designs increased the dead stock.
- Almost all Indian retailers are trying to increase the share of private label in their sales.
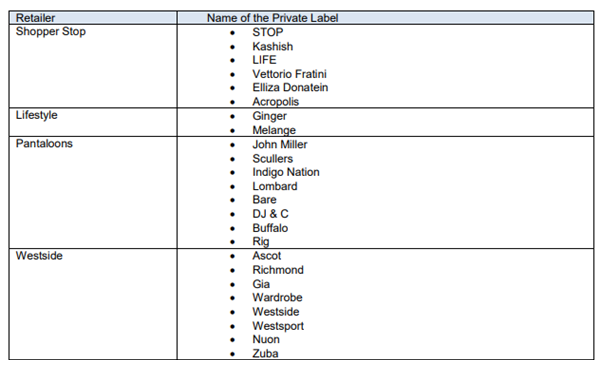
- Some important private labels of the retailers are mentioned below:
Average store size
- Retailers are constantly reducing store sizes to reduce wastage and unused space.
- Retailers are trying to increase productivity by reducing store size.

- Easyday has the smallest stores in the neighbourhood store category. DMart Ready which can be a competition to Easyday has an average size of 200 – 300 Sqft.
- Size of D-Mart stores is smaller than Big Bazaar stores.
- And Westside stores are smallest when compared to their peers
- Zudio has the smallest stores in value retail category, Value retailer includes Brand Factory, Pantaloons and V-Mart.
Revenue per square feet
- It indicates sales generated per square foot of stores. It can be obtained by dividing sales by total square feet of the selling place.
- Retail sales per square foot is a good indicator of store productivity. It demonstrates how effective store layout and retail personnel are at selling products.
- It is an indicator of how efficiently a company uses its assets to make sales.
- In a common scenario higher the revenue per square feet greater the profitability.
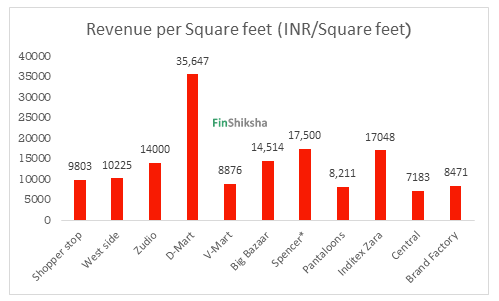 * as on FY 18
- Zudio being a new entrance still enjoys higher productivity than other value retailers due to its small size. All the other value retailers have revenue per square feet in the range of 8000 to 9000 INR/Square feet
- D-Mart enjoys one of the highest productivity in the industry.
- Central has the largest store size hence its productivity is the lowest.
Average Bill size
- It indicates the average amount spent by each shopper in the store. This is computed by the total sales divided by the number of cash memos.
- Average Bill Size (in Rs.) across Retailers is given below:
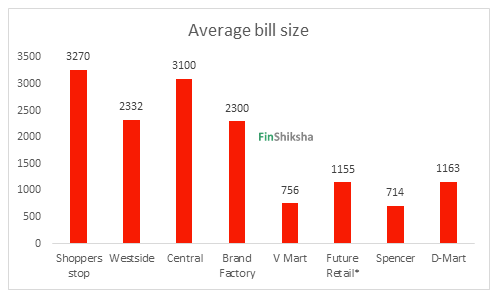 *FY 17
- Shoppers stop has one of the highest average bill size as its average selling price per item is Rs.1277.
- While V-Mart has one of the lowest average bill size as it targets Tier 3 and Tier 4 cities. Nearly 60% of stores are in Tier 3 and tier 4 cities. It has an average selling price of Rs.203.
- Future retail, Spencer and D-mart are predominantly food and grocery players. They generally sell low ticket items.
In the next part, we will continue our discussion on the forecasting, valuation nuances and future trend in the Retail Industry.