Disclaimer: The purpose of this document is purely educational in nature. The idea is to help someone kick-start their analysis on this company. However, this is not to be construed as a recommendation of any sort on the company or its stock. All information has been sourced from publicly available data such as annual reports and news items and the veracity of the sources has not been independently established. Kindly use your judgement while analysing further or using this document.
Introduction:
Infosys was incorporated in Pune, in 1981, as Infosys Consultants Private Limited, a private limited company. Infosys Limited is the second-largest IT services company in India providing consulting and IT services to clients globally.
The Company has its primary listings on BSE Limited and the National Stock Exchange of India Limited in India. The Company’s American Depositary Shares (ADSs or commonly known as American Depositary Receipts ADRs), representing equity shares, are also listed on the New York Stock Exchange (NYSE), Euronext London and Euronext Paris.
Download Excel for Infosys Ltd to Understand Financial Statement Analysis
Business:
Different business models adopted by information technology companies for clients to consume their solution and service offerings are:
- Niche technology consulting companies – who take on time-bound and limited-scope projects for their clients
- Global technology outsourcing companies – who leverage global talent pools to enable business transformation and systematically optimize the IT operations of clients
- Business process management firms – who leverage global talent pools to manage outsourced core business processes of their clients
- Software firms – who provide licensed software that enables the automation of business processes
- Speciality platform and Software-as-a-Service companies – who provide utility-based models for clients to consume software features
- Data analytics companies – who specialize in designing, analysing and reporting insights from the vast amount of data that corporations are collecting about their customers, operations and markets
- Internal IT departments of the companies themselves, which are usually a cost centre for the corporation
The primary objective of Infosys is to help address and solve the client’s business and technology challenges to enable them to better serve their customers. Company’s clients are generally large enterprises and government organization.
The company has end-to-end service offering capabilities in consulting, software application development, integration, maintenance, validation, enterprise system implementation, product engineering, infrastructure management and business process management.
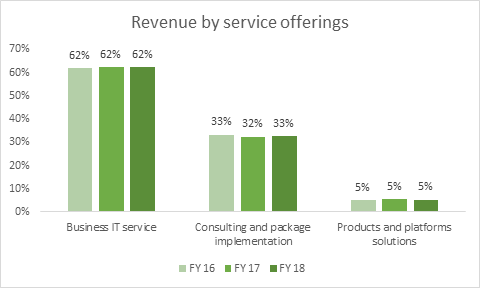
Following are certain important service offerings by the company:
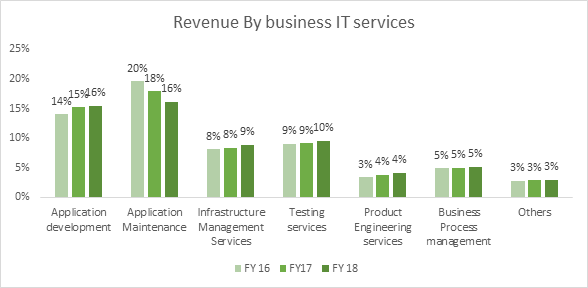
- Business IT service:
The company provides Business with specialized technology-oriented solutions by combining the processes and functions of the software, hardware, networks, telecommunications and electronics according to business or enterprise requirement. Following are the type of business IT services provided by the company:
- Application development
Application development is the process of creating a computer program or a set of programs to perform the different tasks that a business requires. From calculating monthly expenses to scheduling sales reports, applications help businesses automate processes and increase efficiency.
- Application Maintenance
Application Maintenance includes the skills and requirements for supporting application systems, including troubleshooting, modifying, maintaining and enhancing legacy systems.
- Infrastructure Management Services
Infrastructure management is the management of essential operation components, such as policies, processes, equipment, data, human resources, and external contacts, for overall effectiveness.
- Testing services
Under testing services company provides a comprehensive portfolio of solutions that help its clients to reduce the risk of application or system failure.
- Product engineering services
Product Engineering is the process of innovating, designing, developing, testing and deploying a software product.
- Business Process management services
Business Process Management focuses on aligning business operations with the needs and wants of the clients through process optimization.
- Consulting & System integration:
Information technology consulting focuses on advising organizations on how best to use information technology (IT) in achieving their business objectives.
Under system integration company specializes in bringing together component subsystems into a whole and ensuring that those subsystems function together. They also solve problems of automation.
- Products and platforms and Solutions
Important products and platform for the company are as follows:
| Products & Platform | Domain | Verticals |
| EdgeVerve Systems | RPA platform/ Automation tools | BFSI BFSI (Banking and Financial Services), Retail & CPG (Consumer Packaged Goods), Life-science, Manufacturing, communication |
| Finacle | Core banking solutions | BFSI (Banking and Financial Services) |
| Infosys NIA | Automation & AL Platform | All |
| Panaya | Test management & Test automation solution | All |
| Skava | Digital commerce platform | Retail |
| Wingspan | Corporate learning solutions | All |
The company also offers BPM platform. BPM platforms provide a framework and tools for managing the tasks and workflow in a process related to people or systems.
Over the last two years, Infosys has started to offer new services in the areas of cloud applications and infrastructure, mainframe modernization to cloud, cybersecurity, developing new digital end-user experiences, advanced analytics and data science, engineering services and the Internet of Things (IoT Services).
The company provides IT service to companies in the following industry
- Financial Services (BFSI)
- Manufacturing
- Energy & Utilities, Communication and services
- Retail, consumer Packaged goods and logistics
- Life Services, Healthcare and Insurance
- Hi-tech
Example of services Infosys provide in different industries:
- Consumer Package Goods companies are using Infosys Nia for faster revenue reconciliation.
- Pharmaceuticals uses services of Infosys for better forecasting.
- Healthcare and Insurance companies use Infosys products for managing their claim process and settlement.
- Banks are using Infosys products for dynamic fraud analysis, tax relief at source.
- Other applications are smart HR process management to just in time business reporting.
Important industries for different IT companies in India
| TCS | Wipro | HCL | Infosys | Tech Mahindra |
| BFSI (32.3%) | BFSI (28%) | Financial services (13.3%) | Financial services (26.4%) | Communication (43.3%) |
| Retail & CPG (12.2%) | Manufacturing and Technology (23%) | Manufacturing (18.3%) | Energy& Utilities, communication and services (23.8%) | Manufacturing (18.3%) |
| Technology and services (8%) | Consumer BU (16%) | Life science & Healthcare (8.1%) | Retail, consumer packaged goods and logistics (15.8%) | BFSI (8.1%) |
*Numbers in bracket represent their contribution to revenue
As one can see the top contributor to the revenue for all major Information technology firms is the financial sector.
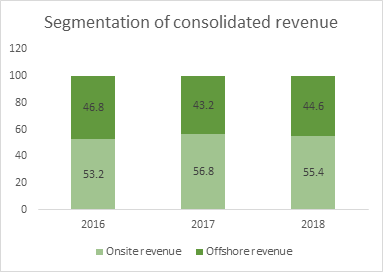
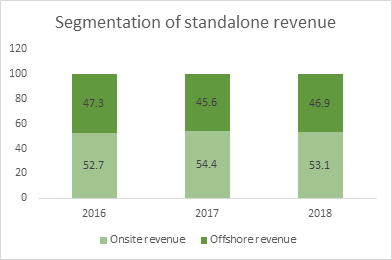
Company’s revenue can be also segmented on the basis of
- Onsite Revenue
Onsite revenues are for those services which are performed at client locations or at the company’s development centres outside India.
- Offshore revenue
Offshore revenues are for services which are performed at the company’s global development centres in India.
The services performed onsite typically generate higher revenues per capita, but at lower gross margins in percentage as compared to the services performed at the company’s own facilities in India. Therefore, any increase in the onsite effort impacts margins.
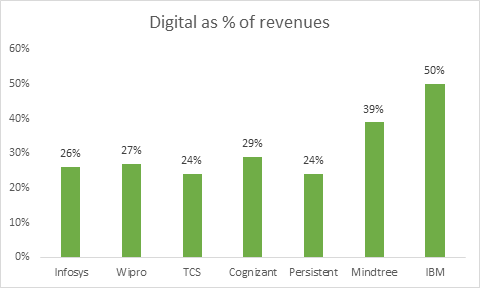
- The overall revenue growth in 2018 was on the back of healthy growth in digital revenues.
- The company defines ‘digital’ as a set of use cases that drive business outcomes for its clients across five areas :
- Experience: Well-designed systems for digital marketing, omnichannel interaction, personalization and content management that can enhance the customer experience
- Insight: AI-based systems for advanced analytics, leveraging Big Data Analytics
- Innovate: Engineering new and digital-first products and offerings leveraging the Internet of Things and advanced industry Software-as-a-Service (SaaS) platforms
- Accelerate: The digitization of core systems by migrating to cloud technologies, abstracting APIs, modernizing legacy systems and infrastructure, integrating applications and leveraging Robotic Process Automation (RPA)
- Assure: Implementing advanced cyber-security systems and specialized validation of software systems.
- These elements together form digital services offered by Infosys.
- Digital revenue during fiscal 2018 amounted to ₹17,992 crore (US$ 2,791 million) or 25.5% of the total revenues.
- These five areas of the digital market, by most industry analyst’s external views, represents about $160 billion of the addressable market today and it is growing at a very rapid pace, mid-teens, maybe high teens, some people even think it is as much as 20% growth.
- FY18, the IT major won new deals worth >US$3bn (PY 3.48 billion dollars) out of which 30-32% were for new business.
- Infosys is focusing on localization for this purpose the company has a target of 10,000 local hires for the USA.
- Infosys has announced a strategic partnership with ABN AMRO by acquiring 75% shareholding in Stater NV (a subsidiary of ABN AMRO) which provides pure-play, end-to-end mortgage administration services in Netherlands, Belgium and Germany. Infosys will pay EUR 127.5 mn (~USD 143 mn) for the 75% stake.
- The company had 20 subsidiaries and 26 steps down subsidiaries as on 31st March 2018.
Revenue Drivers:
- Infosys’s revenue has grown at a CAGR of 14% from 2009 to 2018.
- According to Indian AS, in 2018 the company’s revenue grew by 3% from 68484 crores in 2017 to 70522 crore in 2018. However, Infosys observed a 7.2% growth in revenue in US dollar terms.
- The increase in revenue is primarily attributed to an increase in revenue from Europe by 9% while revenue from India grew by 2.34% and revenue from America grew marginally by 0.39%.
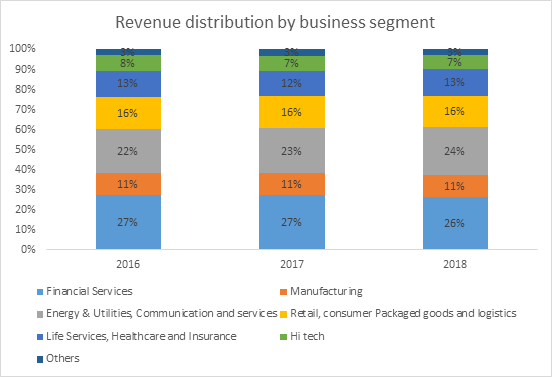
- Lifestyle, healthcare and insurance business was the highest contributor to the increase in revenue at 10% followed by energy & Utilities, communication and services.
Changes in revenue from a different business segment that the company serves
| Particulars | Changes in revenue in 2018 |
| Financial Services | 0% |
| Manufacturing | 3% |
| Energy & Utilities, Communication and services | 9% |
| Retail, consumer Packaged goods and logistics | -1% |
| Life Services, Healthcare and Insurance | 10% |
| Hi-tech | -1% |
| Others | -9% |
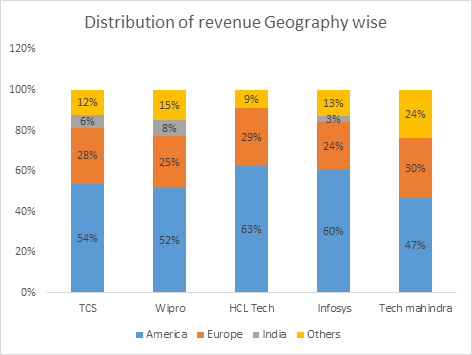
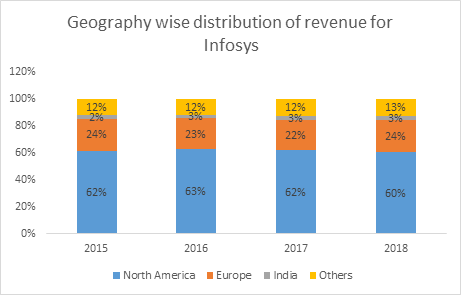
- All major IT companies in India generate nearly 50% of their revenue from America especially North America followed by Europe.
- Infosys generates approximately 60% of its revenue from North America however the contribution of America to the total revenue is decreasing continuously from 2016.
- Revenue growth was also attributable to a number of factors, including an increase in the volume, as well as an expansion in the solutions that the company provides to its clients.
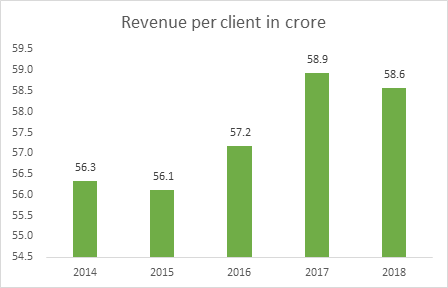
- Company’s revenue per client has reduced marginally in 2018 however the company’s revenue increased by 3% this is mainly attributed to the increase in the number of clients by 283 clients.
- The company had 1204 clients as on 31st March 2018.
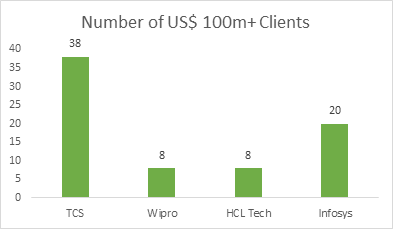
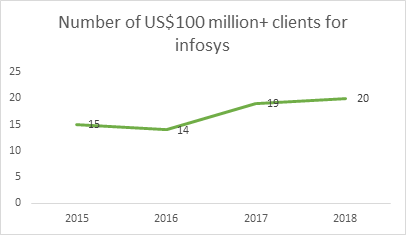
- The company has the second highest number of US$ 100million + clients among major IT companies in India.
- It is important to note that the company derives 98.5% (PY 97.3%) of its consolidated revenues from repeat business in 2018 fiscal. which company defines as revenues from a client that also contributed to the revenues during the prior fiscal year.
- Revenue from the top 10 customers as of 2018 was 19.3% (PY 21%)
- India’s IT industry grew to US$ 181 billion in 2018-19. Exports from the industry increased to US$ 137 billion in FY19 while domestic revenues (including hardware) advanced to US$ 44 billion.
- The United States approximately accounts for two-thirds of India’s IT services exports.
- The information technology sector has increased its contribution to India’s GDP from 1.2% in 1998 to 7.7% in 2017.
- India is the leading sourcing destination across the world, accounting for approximately 55 per cent market share of the US$ 185-190 billion global services sourcing business in 2017-18.
- The share of Indian players in the global IT sourcing market stood at 67 per cent in 2017 (60 per cent in 2012).
Cost Drivers:
- The important costs for the company are employee benefits expense followed by the cost of sub-contracting.
| Particulars | FY 15 | FY 16 | FY 17 | FY 18 |
| Employee Benefit Expense | 56% | 55% | 55% | 55% |
| Cost of technical sub-contractor | 4% | 6% | 6% | 6% |
- Employee benefit expenses are the largest cost for any information technology company.
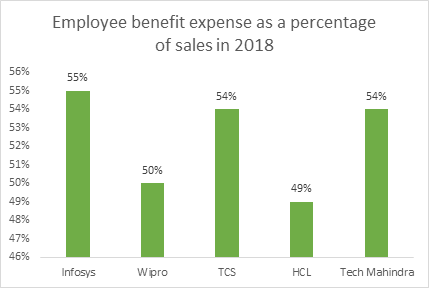
- Infosys has the highest employee benefit cost as a percentage of sales.
- However, it is constant at 55% for the last three years. While employee benefits expense as a percentage of sales is continuously increasing in case of Wipro (From 48% in 2016 to 50% in 2018) and TCS (from 51% in 2016 to 54% in 2018).
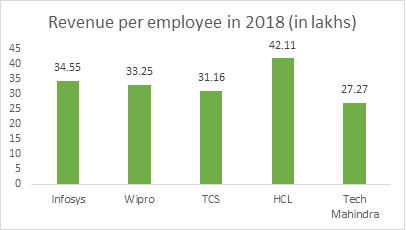
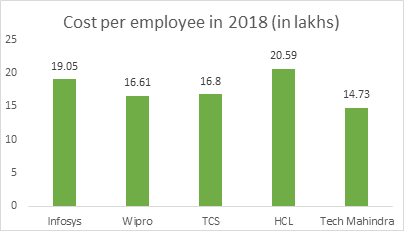
- HCL technologies have the highest revenue per employee as well as cost per employee. Followed by Infosys and Wipro.
- TCS has revenue per employee lower than Wipro but the cost per employee is higher than Wipro.
- Tech Mahindra has the lowest revenue per employee as well as the lowest cost per employee.
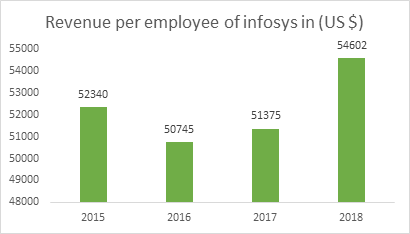
- Infosys’s revenue per employee increased by 6.3% in US $ terms during the year 2017-18.
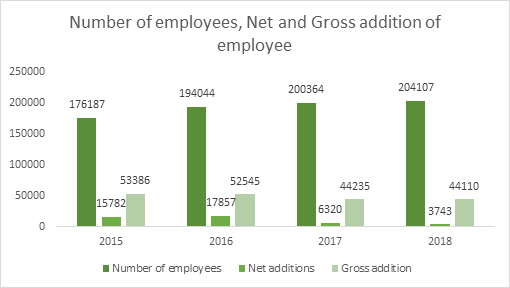
- The net, as well as the gross addition of employees, is continuously reducing indicating a fall in the growth of the number of employees.
- The attrition rate for the fiscal year 2018 stands at 19.2% as compared to 20% for the previous year. This is a negative signal in overall terms as 1/5th of the workforce leave every year.
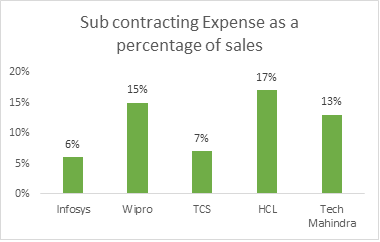
- Cost of technical sub-contracting is lowest for the company when compared to other information technology firms. This indicates that Infosys and TCS are least dependent on the third party for outsourcing work as compared to others.
- The subcontractor expenses are driven primarily by utilization level and onsite talent demand.
Ratio Analysis:
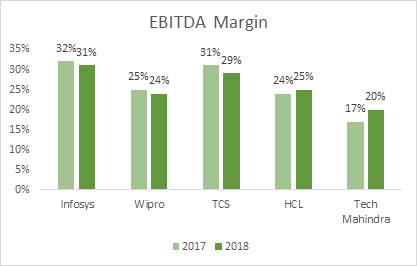
- The company has a stable EBITDA margin at 32%.
- Company’s net profit margin Improved in 2018 due to a decrease in tax expenses. The company in accordance with the advance pricing agreement reversed the income tax provision of Rs.1432 crore, pertaining to the previous year.
| Profitability Ratios | 2015 | 2016 | 2017 | 2018 |
| Operating Profit Margin | 34.3% | 32.4% | 31.7% | 31.5% |
| Net Profit Margin | 23.2% | 21.6% | 21.0% |
22.7% |
- Overall segment profitability has marginally declined primarily on account of adverse currency impact of rupee appreciation, compensation increases and higher variable pay-outs.
- The company wants to sell Khallidus, Skava and Panaya. Impairment loss of Rs.118 crore in respect of Panaya has been recognised in the P&L.
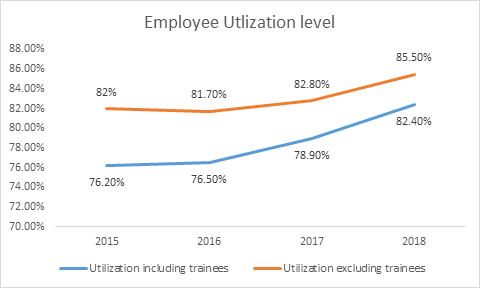
- However, these effects were partially offset by cross-currency benefit, improved operational parameters – higher utilization, benefits on account of automation, lower onsite mix and optimization of general and administrative costs etc.
- The company enjoys high operating profit margin from the services it provides in the financial sector, Retail consumer packaged goods and logistics and life services, healthcare and insurance sector.
- Although revenue growth from the Energy & Utilities, Communication and services sector is high at 9% in 2018 operating margins from this segment has been continuously reducing.
- Operating margins from Indian business is the highest for the company. While revenue growth from this segment is marginal at 3%.
- Operating Margins from Europe and North America has reduced in 2018.
| Operating profit margin by business segment | 2016 | 2017 | 2018 |
| Financial Services | 28% | 28% | 28% |
| Manufacturing | 22% | 25% | 24% |
| Energy & Utilities, Communication and services | 30% | 29% | 27% |
| Retail, consumer Packaged goods and logistics | 28% | 29% | 29% |
| Life Services, Healthcare and Insurance | 28% | 27% | 28% |
| Hi-tech | 27% | 25% | 24% |
| Others | 15% | 13% | 19% |
| Operating profit margin by business segment | 2015 | 2016 | 2017 | 2018 |
| North America | 28% | 26% | 26% | 25% |
| Europe | 27% | 27% | 27% | 26% |
| India | 24% | 35% | 34% | 40% |
| Others | 31% | 32% | 32% | 32% |
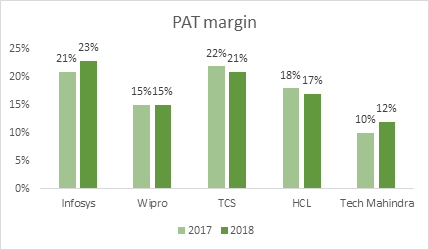
- Infosys and TCS have superior profit margin when compared to its competitors. One of the reasons for this is the lower cost of technical sub-contractor for both Infosys and TCS when compared to its competitors.
- Company’s working capital as a percentage of sales is stable indicating efficiency in managing working capital.
- Infosys gives its customers a 68 days credit period which is in line with its competitors.
- The company has the lowest payable days in the industry.
| Efficiency ratio | 2015 | 2016 | 2017 | 2018 |
| Receivable days | 67 | 66 | 66 | 68 |
| Payable days | 1 | 2 | 2 | 4 |
| Cash conversion cycle | 66 | 64 | 64 | 64 |
| Working capital as a percentage of sales | 18% | 18% | 17% | 18% |
| Particulars | Infosys | Wipro | TCS | HCL | Tech Mahindra |
| Receivable days | 68 | 68 | 74 | 70 | 77 |
| Payable days | 4 | 34 | 15 | 7 | 24 |
- The company is completely debt free. Excellent sign.
- Company’s return ratio has improved in 2018 due to increase in net profit margin and increase in asset turnover ratio. Asset turnover ratio improved in 2018 due to the reduction in total assets by 4%.
- Infosys conducted Share buyback of Rs.13000 crore (113043478 shares) which resulted in a reduction in Equity thus boosting return ratio.
| Return Ratios | 2015 | 2016 | 2017 | 2018 |
| Return on Equity | 22.6% | 21.8% | 20.8% | 24.7% |
| Return on Capital Employed | 31.6% | 30.3% | 28.9% | 31.2% |
| Asset turnover ratio | 0.80 | 0.83 | 0.82 | 0.88 |
- Company’s cash flow from operations as a percentage of net profit is continuously increasing which is a positive sign. Short term investments and cash and cash equivalent form nearly 33% of the balance sheet size. This is in line with its competitors Wipro and TCS.
- The Board has the policy of returning up to 70% of the free cash flow to shareholders.
- In 2018 the company had a positive cash flow from investing primarily due to the sale of liquid mutual funds. However, in 2018 the company incurred a CAPEX of Rs.1823 crore for infrastructure, computers and vehicles. In 2018 the company also acquired WongDoody Holding Company for a consideration of Rs.489 crore.
- The company had a negative cash flow from financing activities due to the payment of dividends and buybacks.
| Cash flow in crore | 2015 | 2016 | 2017 | 2018 |
| Cash flow from operating activities | 8353 | 10028 | 11531 | 13218 |
| Cash flow from investing activities | 1088 | -901 | -14542 | 4452 |
| Cash flow from financing activities | -4935 | -6813 | -6939 | -20505 |
| Cash flow from operations as a percentage of net profit | 68% | 74% | 80% | 82% |
Cash and cash equivalent and Current investments as a percentage of capital employed
| Companies | 2015 | 2016 | 2017 | 2018 |
| Infosys | 47% | 43% | 39% | 33% |
| Wipro | 42% | 42% | 44% | 39% |
| TCS | 27% | 33% | 44% | 40% |
| HCL | 30% | 25% | 22% | 13% |
| Tech Mahindra | 17% | 23% | 21% | 21% |
Management’s Quality:
- Promoter’s holding was 12.82% as on December 2018
| Name of the investor | Shareholding as on 1/4/2017 (in %) | Shareholding as on 31/3/2018 (in %) |
| Life Insurance Corporation of India | 7.03 | 6.85 |
| HDFC Mutual Fund | 1.67 | 2.78 |
| ICICI Prudential Mutual Fund | 1.45 | 1.85 |
| SBI Mutual fund | 1.14 | 1.41 |
| Vanguard Emerging Market Stock Index Fund | 1.31 | 1.36 |
Foreign institutional investors/FPI holding was 38.31% as on 31st March 2018
- The company has 9 board of directors out of which 6 are independent directors.
| Particulars | 2015 | 2016 | 2017 | 2018 |
| Remuneration of management | 30.25 | 93.39 | 79.08 | 81.95 |
| Remuneration of management as % of net profit | 0.2% | 0.7% | 0.6% | 0.5% |
- Management’s remuneration as a percentage of net profit is constant.
Broad Valuation Parameters:
- Market capitalisation: 3,30,000 crore as on 5th April 2019
- PE: 21
- Price to sales: 4.68
| Companies | PE |
| TCS | 29 |
| Infosys | 21 |
| Wipro | 19 |
| HCL Tech | 16.8 |
| Tech Mahindra | 18.3 |